

If you've been watching the Bitcoin market these days, you've probably noticed its recent recovery above $105,000. Current price patterns and investor behavior data are sending signals that could anticipate a new all-time high very soon. But how reliable are these indicators, and what should we expect in the coming days?
The Double Bottom Anticipating a New Bitcoin Rally
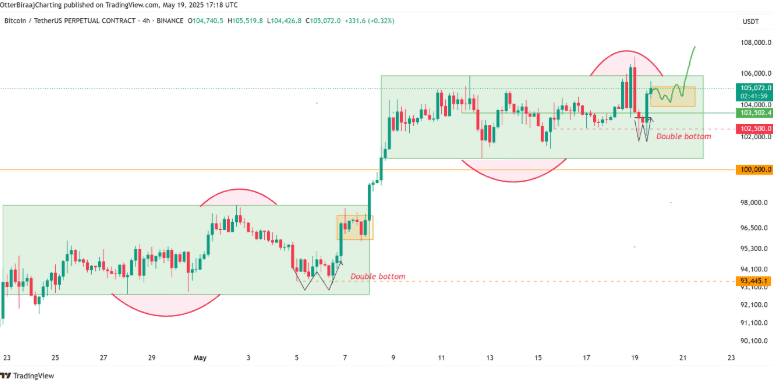
The Bitcoin market has just formed a technical pattern that has many analysts expectant. During the recent trading session in the US market, BTC managed to recover above $105,000 after establishing a double bottom pattern on the 1-hour chart. This type of configuration is typically a bullish signal that anticipates a trend change.
What's interesting is that the liquidity zone around $102,500 has been completely absorbed by the market. This is not a minor detail: when available liquidity at a price level is depleted, perfect conditions are created for the asset to seek new valuation levels. In this case, it appears to be laying the groundwork for Bitcoin to seek new highs this very week.
Fractal Patterns: History Repeating Itself?
Bitcoin's current behavior between the ranges of $106,300 and $100,600 shows a surprisingly similar configuration to its previous range between $97,900 and $92,700. This type of pattern repetition, known as fractal analysis, can give us valuable clues about what might happen next.
The three conditions that characterize this pattern are:
- Immediate trend reversals at the range boundaries
- Formation of a double bottom after reaching the range highs
- The double bottom established above the range lows
If this pattern continues to replicate, we could see Bitcoin consolidating between $103,500 and $105,200 over the next 24 hours, similar to the previous sideways movement it experienced between $95,800 and $97,300. If this parallelism holds, the chances of Bitcoin breaking above the $107,000 barrier significantly increase, potentially reaching new highs above $110,000 before the weekend.
What On-Chain Data Reveals About Investor Behavior
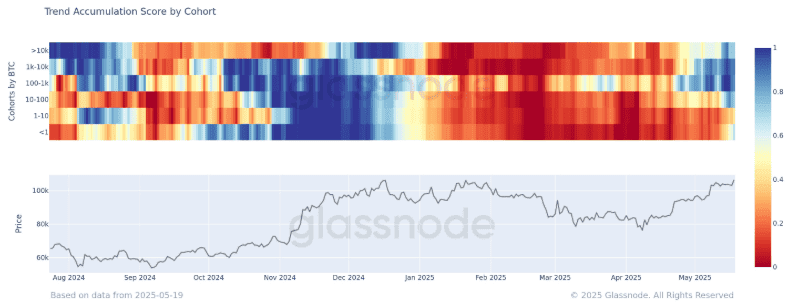
Technical analysis isn't the only indicator suggesting a bullish movement. On-chain data provided by Glassnode shows a significant shift in Bitcoin investor behavior, revealing important details about who's buying and who's selling.
The recent Accumulation Trend Score shows that even small holders (those with less than 1 BTC) are joining the bullish trend with a score of 0.55. Even more revealing is that large investors are accumulating strongly:
- Investors who own between 100 and 1,000 BTC show an accumulation score of 0.9
- Those holding between 1,000 and 10,000 BTC present a score of 0.85
According to historical data, when we see this level of accumulation among different holder groups, it often precedes important rallies in Bitcoin's price. It's particularly significant that only the investor group with 1-10 BTC wallets remains in distribution phase (selling), while the rest of the market is clearly in accumulation mode.
The Shadow of Bearish Divergence: An Obstacle to New Highs?
Despite the bullish signals, there is a technical factor generating doubts among some analysts. Renowned cryptocurrency analyst Bluntz has identified a bearish divergence on Bitcoin's daily chart, which could complicate the path to new all-time highs this week.
This divergence occurs when Bitcoin's price is forming higher highs, but the relative strength index (RSI) indicator is forming lower highs. This technical mismatch suggests that buying pressure is beginning to weaken as prices rise, which could indicate a loss of bullish momentum.
Meanwhile, analyst Matthew Hyland has pointed out that if bulls want to maintain control of the market, they need to push Bitcoin's price considerably higher in the coming weeks. Specifically, Hyland states that BTC "probably needs to make a move to $120,000-$130,000 in the coming weeks to achieve a higher high on the RSI and prevent any weekly bearish divergence from being confirmed."
What to Expect in the Coming Days?
If the identified fractal patterns continue to develop as expected, Bitcoin could briefly consolidate before attempting to overcome the $107,000 resistance. A close above this level would open the door for an advance towards $110,000 and potentially towards the $120,000-$130,000 range that analysts consider necessary to confirm the continuation of the bullish trend.
However, if Bitcoin fails to maintain support at $103,500, we could see a test of the support level at $102,000. This breakdown of the fractal pattern could invalidate short-term bullish projections and open the possibility of new lows below $102,000.
The truth is that the Bitcoin market is at a crucial point. On-chain data shows strong accumulation among almost all investor groups, which historically has been a bullish signal. At the same time, technical patterns suggest the possibility of new highs in the short term, albeit with the warning of a possible bearish divergence that could limit the immediate scope of the movement.
As always in the cryptocurrency world, it will be essential to closely monitor key levels and be prepared to quickly adapt to changes in market dynamics.